hair tissue mineral analysis
Hair Tissue Mineral Analysis is used worldwide by clinicians, practitioners and scientists. In a single hair sample, the tissue is stable over time and provides several months of biochemical activity versus just a snapshot from blood work. Obtaining the sample is inexpensive and non-invasive, and can be completed without medical intervention.
Biochemical, physical, and emotional stressors deplete the body of essential nutrients. In stages and over time, chronic illness may develop and as well environmental illness may arise as a result of exposure to environmental toxins. These issues, combined so many health assaults, result in the accumulation of toxins in tissues and may completely disrupt normal body chemistry.
The HTMA lab test quantifies deficiencies or excesses in essential mineral levels, significant and identifies toxic heavy metals of concern. A complete lab report uses charts, graphs, and supportive documentation to show an individual’s unique metabolic status, and provides corrective recommendations to address mineral imbalances, erase debilitating symptoms and revitalize cellular metabolism.
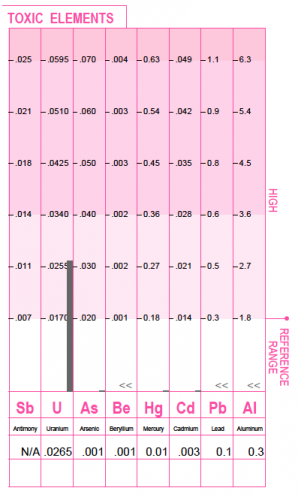
toxic elements
The toxic element’s section displays the results for each of the reported toxic elements. It is preferable that all levels be as low as possible and within the lower white reference range. Any test result that falls within the upper dark red areas should be considered as statistically significant. Further investigation may be warranted to determine the possibility of actual clinical significance. The toxic minerals (heavy metals) are well – known for their interference on normal biochemical functions. These toxins are commonly found in the environment and therefore are present to some degree in all biological systems. However, these metals clearly pose a concern for toxicity when tissue accumulation occurs to excess.
Toxic Elements: This chart shows uranium well above the established reference range. Uranium can be found in elevated in geographical areas around the world. Some digging into the client’s home here is going to be important as uranium at these levels can be caused by the presence of radon in the home. Testing for radon in this case would be relevant at quantifying exposure.
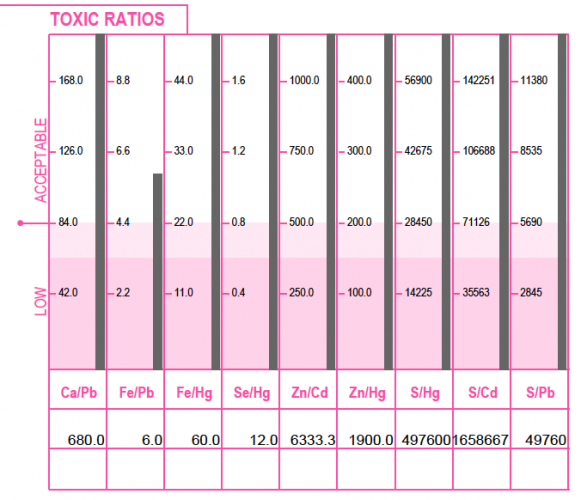
toxic ratios
This section displays the relationships between the important nutritional elements and toxic metals. Each toxic metal ratio result should be in the upper white area of the graph, the higher the better. Toxic ratios that fall within the darker red areal may indicate an interference of the toxic metal upon the utilization of nutritional element.
To some degree, every person is exposed to toxic metals. The retention of these toxic metals, however, is dependent upon the individual’s susceptibility. The balance of the protective nutrient minerals within the body in relation to the heavy metals can frequently determine susceptibility. As an example, the accumulation of lead will have a more detrimental effect upon body chemistry when sufficient levels of calcium and iron are not available. By examining the toxic metal levels in relation to the protective minerals, the extent to which the heavy metals may be involved in abnormal chemistry can frequently be seen.
Toxic Ratios: This chart shows both a low Fe/Pb level. When iron levels within the body are sufficient, these minerals can produce an antagonistic or protective response to the adverse affects of lead. However, when iron is low in relation to lead, its protective action upon lead may become reduced.
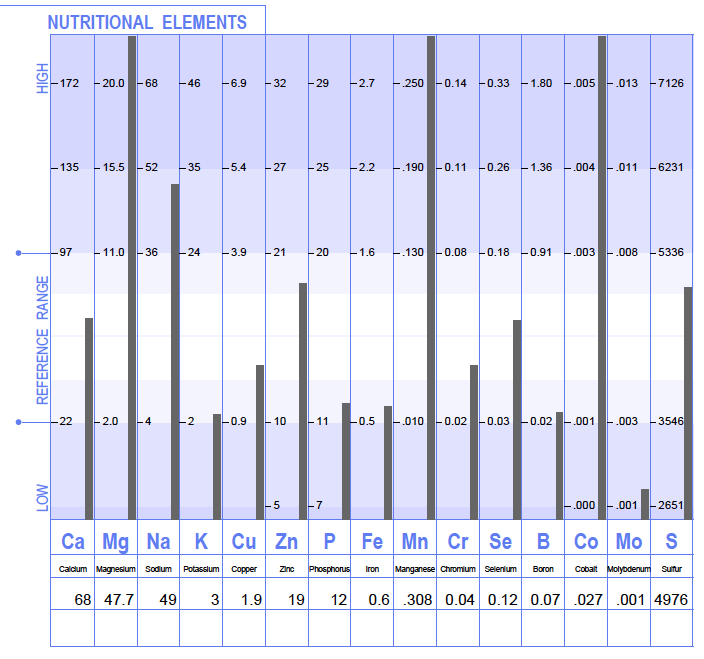
Nutritional elements
The nutrient minerals have been well defined and are considered essential for many biological functions. They play key roles in such metabolic processes as muscle activity, reproduction, endocrine function, skeletal integrity, and overall development. This section of the report shows nutritional mineral levels that may reveal moderate or significant deviations from normal. The white area of the graph’s mineral levels represents the established reference ranges as determined from the statistical analysis of healthy people.
Nutritional Elements: This chart shows intracellular magnesium loss due to elevated tissue calcium. Magnesium is the fourth most abundant metal found in the body, and is essential for muscle relaxation, protein synthesis, nerve excitability and energy production on a cellular level. We can also identify elevated sodium and when sodium is at present at high levels it promotes inflammation and identifies intense stress. This will cause the individual to be moody, fly off the handle, retain water, and more. Please note there are many more excesses and deficiencies present in this particular chart.
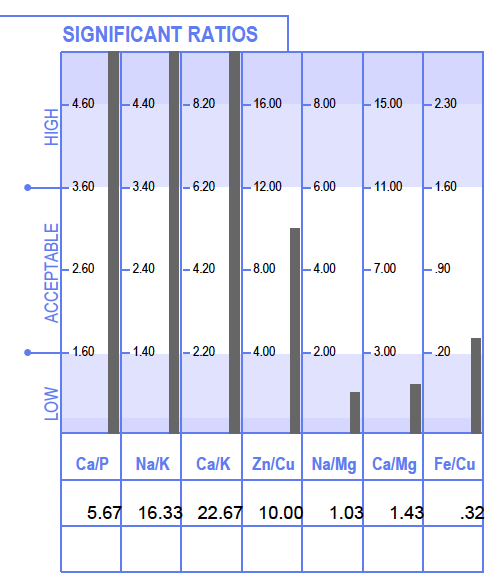
significANT RATIOS
The significant ratios bring to light critically important mineral relationships. Mineral relationships are actually more important than the individual mineral levels. The ratios reflect the critical balance that must be constantly maintained between the minerals in the body for healthy metabolic function and optimal cellular energy production.
Continuing research indicates that metabolic dysfunctions occur not necessarily because of a deficiencies or excesses of a certain mineral level, but more frequently from an abnormal ratio between the minerals. Due to this complex interrelationship between the minerals, it is extremely important that imbalances be determined. Once these imbalances are identified, corrective therapy may then be used to help re-establish a more normal biochemical balance.
Significant Ratios: This chart shows a high Ca/P, Na/K and Ca/K ratios. High calcium relative to phosphorus identifies metabolic rates, an elevated sodium to potassium ratio is representative of intense stress and calcium to potassium will frequently indicate a trend toward hypothyroidism (under – active thyroid). The mineral calcium antagonizes the retention of potassium within the cell. Since potassium is necessary in sufficient quantity to sensitize the tissues to the effects of thyroid hormones, a high Ca/K ratio would suggest reduced thyroid function and/or cellular response to thyroxine. We also see here low Na/Mg, Ca/Mg and Fe/Cu ratios. A low sodium to magnesium ratio represents adrenal insufficiency, a low calcium to magnesium will tell us about blood sugar imbalances and a low iron to copper ratio (infection ratio), although within the reference range, could point us towards the presence of a viral infection.